gdf = gpd.read_file('example_data/R70C21.shp')
im_path = 'example_data/R70C21.tif'
with rio.open(im_path) as im:
im_data = im.read()
plt.imshow(im_data.swapaxes(0,2).swapaxes(0,1))
plt.show()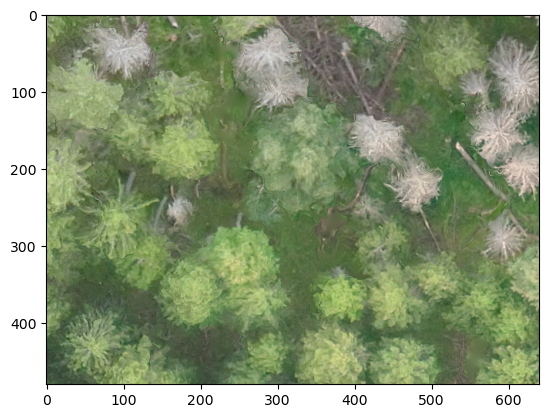
def list_to_affine(
    xform_mat:list
)->Affine:
Adapted from Solaris.geo. Creates an affine object from array-formatted list
def get_geo_transform(
    src
)->Affine:
Extract geotransform for a raster image source
def convert_poly_coords(
    geom:shape, raster_src:str=None, affine_obj:Affine=None, inverse:bool=False, precision:NoneType=None
)->shape:
Adapted from solaris. Converts georeferenced coordinates to pixel coordinates and vice versa
def affine_transform_gdf(
    gdf:GeoDataFrame, affine_obj:Affine, inverse:bool=False, geom_col:str='geometry', precision:int=None
)->GeoDataFrame:
Adapted from solaris, transforms all geometries in GeoDataFrame to pixel coordinates from Georeferced coordinates and vice versa
def gdf_to_px(
    gdf:GeoDataFrame, im_path, geom_col:str='geometry', precision:int=None, outpath:NoneType=None,
    override_crs:bool=False
)->GeoDataFrame:
*Adapted from https://solaris.readthedocs.io/en/latest/_modules/solaris/vector/polygon.html#geojson_to_px_gdf* Converts gdf to pixel coordinates based on image in im_path
def georegister_px_df(
    df:DataFrame, im_path:NoneType=None, affine_obj:Affine=None, crs:NoneType=None, geom_col:str='geometry',
    precision:int=None, output_path:NoneType=None
)->GeoDataFrame:
Convert geodataframe from pixel coordinates to crs, using affine_obj as the reference
gdf = gpd.read_file('example_data/R70C21.shp')
im_path = 'example_data/R70C21.tif'

with rio.open(im_path) as im:
    im_data = im.read()
plt.imshow(im_data.swapaxes(0,2).swapaxes(0,1))
plt.show()
gdf.plot(column='label', #facecolor='none',
         edgecolor='black', lw=0.7, cmap='viridis')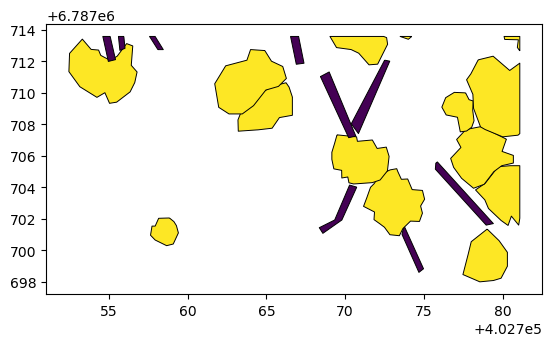
tfmd_gdf = gdf_to_px(gdf, im_path)
tfmd_gdf.plot(column='label', #facecolor='none',
              edgecolor='black', lw=0.7, cmap='viridis')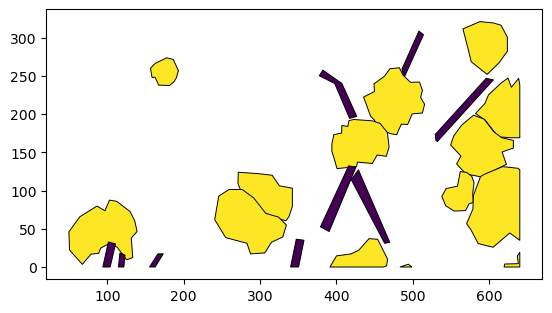
Origin in lower left for this data.
fig, ax = plt.subplots()
ax.imshow(im_data.swapaxes(0,2).swapaxes(0,1))
tfmd_gdf.plot(ax=ax, column='label', facecolor='none', edgecolor='black', lw=0.7, cmap='viridis')
plt.show()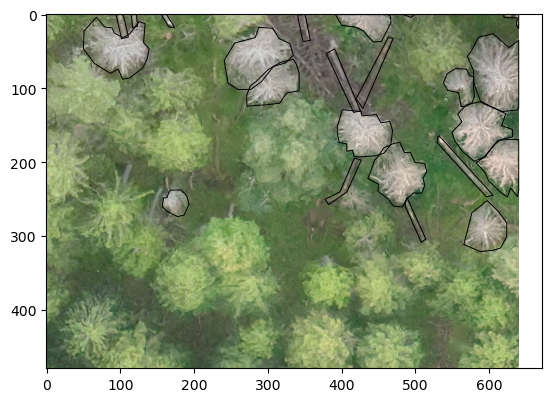
Overlaid on image coordinates are correct
tfmd_gdf = georegister_px_df(tfmd_gdf, im_path)
tfmd_gdf.plot(column='label', facecolor='none', edgecolor='black', lw=0.7, cmap='viridis')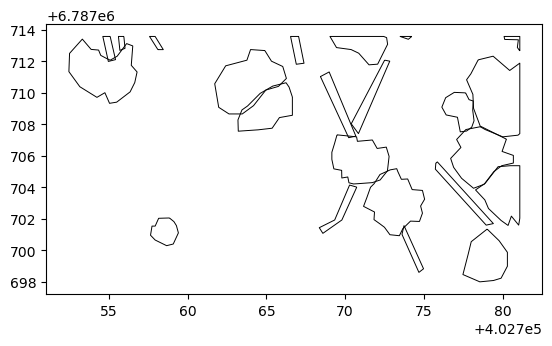
Backwards transformation works